 |
||||||
|
|
||||||
|
|
DATA AND FILES:
This page provides links to data files. These are provided for convenience of downloading related to specific projects or particular data requests, and are not fully explained here.
Library of Downscaled Climate Projections
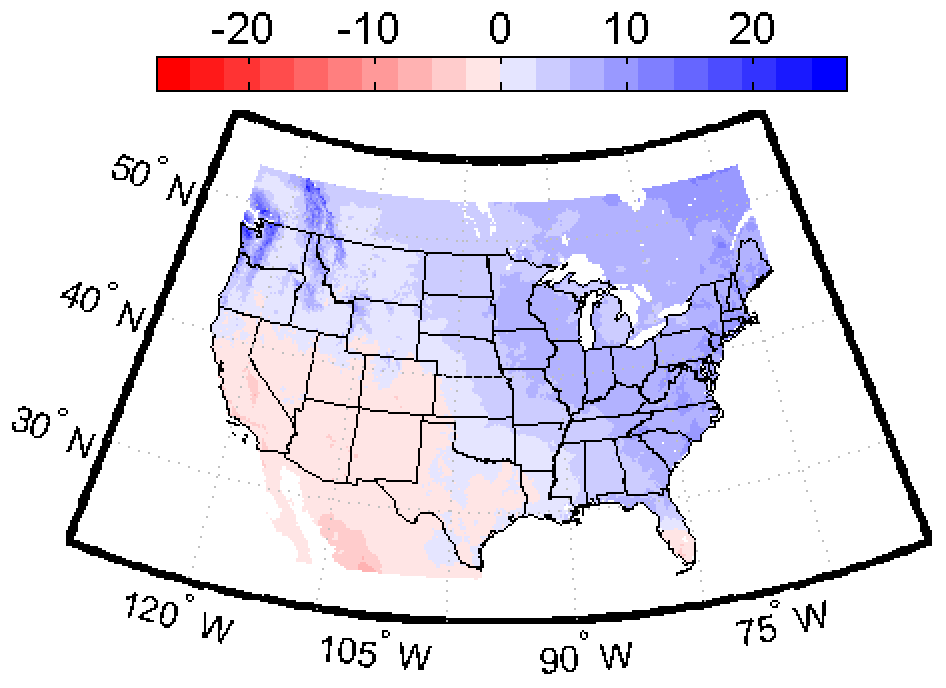
A data set of 112 downscaled climate projections, based on output from 16 GCMs and 3 different SRES emissions scenarios (A2, A1B, B1) has been made available for public downloading. The spatial domain is shown in the figure, covering the conterminous US plus portions of Canada and Mexico. The resolution is 1/8 degree (~140 km2 per grid cell). Raw monthly data for any region as well as summary statistics may be specified. The data set is formally introduced in AGU's Eos 88(47), 11/2007. Click here to be redirected to the web site, hosted by the Green Data Oasis. Streamflow was also derived as part of the USBR WaterSmart project, and is available here, with documentation here.
Much of this data for the U.S. is also served by the USGS Geo Data Portal, along with many other data sets, both of observations and downscaled climate projections.
Global Downscaled Data
Downscaled global CMIP3 GCM output are served here. This covers global land areas at a 1/2-degree (about 50 km) spatial resolution. A similar downscaled product using CMIP5 GCM runs is available here.
Both the global and US-wide datasets are included in the Climate Wizard: http://www.climatewizard.org. Both CMIP3 and CMIP5 globally downscaled data and analysis can be obtained at the Climate Wizard Custom website: http://climatewizardcustom.org/
Daily global downscaled data (0.25 degree spatial resolution) is available on the NASA NEX server: dataset information; data download.
Derived daily extreme statistics for CMIP3 projections are available here: http://climateknowledgeportal.climatewizard.org/, produced as part of an effort by the World Bank, described here: http://sdwebx.worldbank.org/climateportal. A document describing these data is here.
Gridded Observed Meteorological Data:
Link to new updated datasets: 1949-2010 (in process as of March 2011)
Note: it was identified that there is a spatial shift in the wind field in both the original 1949-1999 and in the updated 1/8-degree US-wide data served here. The interpolation placed the 10m winds approximately 1.5 degrees to the North and West. As these data sets are being updated at a finer resolution, no correction to these data sets are anticipated.
The link below brings you to directories of files of monthly or daily gridded observations at 1/8 degree spatial resolution (about 12 km). These are available in individual files for each year from 1950-1999. These are described in detail in the reference:
Maurer, E.P., A.W. Wood, J.C. Adam, D.P. Lettenmaier, and B. Nijssen, 2002, A Long-Term Hydrologically-Based Data Set of Land Surface Fluxes and States for the Conterminous United States, J. Climate 15(22), 3237-3251
That should be referenced anytime this data set is used. The original
binary format data for 1949-2000 are at the University
of Washington site. The link below is to a set of 1950-1999 files
reformatted into the common netCDF format, to be more compatible with
climate model and other meteorological data formats, as well as the
handy NCO Utilities
and CDAT
software. Files are named in the format:
gridded_obs.<timestep>.<variable>.<year>.nc
where <timestep> is "daily" or "monthly",
<variable> is Tavg, Tmin, Tmax, Prcp, or Wind. See
file headers for details.
The newer 1/16 degree daily gridded data beginning in 1915 (see the Livneh et al., 2013 reference on the "Publications" page for documentation) are available here. This has also been expanded to include Mexico and Canada, and is available from the U.S. Bureau of Reclamation here.
CA Governor's Project: 2005-06
I have completed the climate data downscaling for the selected GCMs, and generated daily and monthly climate data and hydrologic variables (soil moisture, snowpack, streamflow). Due to excessive data volume, these files are not available through this server, but may be obtained as described on a web page of the California Climate Change Center.
"PNAS" and other downscaled GCM data: Data from HadCM3 and PCM for SRES scenarios A1fi and B1, as used in the 2004 Hayhoe et al. PNAS paper. Other data is from the IPCC AR4 simulations.
Citation for this data: Hayhoe, K., D. Cayan, C. Field, P. Frumhoff, E. Maurer, N. Miller, S. Moser, S. Schneider, K. Cahill, E. Cleland, L. Dale, R. Drapek, R. M. Hanemann, L. Kalkstein, J. Lenihan, C. Lunch, R. Neilson, S. Sheridan, and J. Verville, 2004, Emissions pathways, climate change, and impacts on California, Proceedings of the National Academy of Sciences (PNAS) 101 (34), 12422–12427.
Data Updates:
-
8 March 2006: HadCM3 and PCM data revised. Monthly time index reduced by 1 to correspond to metadata.
-
8 March 2006: HadCM3 and PCM bias correction procedure for temperature corrected for minor bug in code. This results in very small differences in long-term temperature trends (less than 0.2°C change from old data in the difference in projected warming between 2071-2100 and 1961-1990) and no change in precipitaiton.
- 8 March 2006: Bias correction/downscaling period uses 1960-1999 for HadCM3 and PCM data, and 1950-1999 for all other GCM data.
Files (netcdf format, compressed with gzip) contain 10 years of monthly precipitation and air temperature data downscaled to a 1/8 degree spatial resolution. Files are named us_<model>.<scenario>.<timestep>.<variable>.<years>.nc.gz
-
<model> is hadcm3, pcm or gfdl
-
<scenario> is A1 (or sresa1fi) for A1fi case; B1 or sresb1
-
<timestep> is monthly
- variable is Tavg (monthly average temperature) or Prcp (monthly accumulated precipitation)
-
years defines the time period, e.g. 2040-2049. Decades from 1960-2099 are included for HadCM# and PCM, 1950-2099 for other GCMs.
| HadCM3 Monthly Data (8-Mar-2006) |
PCM Monthly Data |
GFDL 2.1 Monthly
Data |
Summary Plots of Differences between 1961-1990 and 2070-2099 averages (DJF (winter) = December-February; JJA (summer) = June-August):
| Model | Scenario | Summary Plots of Precipitation and Temperature Changes | Zipped file of postscript plots |
| HadCM3 | A1fi | Precipitation; Surface Air Temperature | HadCM3 plots |
| HadCM3 | B1 | Precipitation; Surface Air Temperature | |
| PCM | A1fi | Precipitation; Surface Air Temperature | PCM plots |
| PCM | B1 | Precipitation; Surface Air Temperature | |
| GFDL 2.1 | A1fi | Precipitation; Surface Air Temperature | |
| GFDL 2.1 | B1 | Precipitation; Surface Air Temperature |
Elevations (in meters) for each grid cell are included in the file here, in the Arc/INFO gridascii format.